 Experience Ultra-Low Latency Trading —
  Trade with a Regulated Global Broker
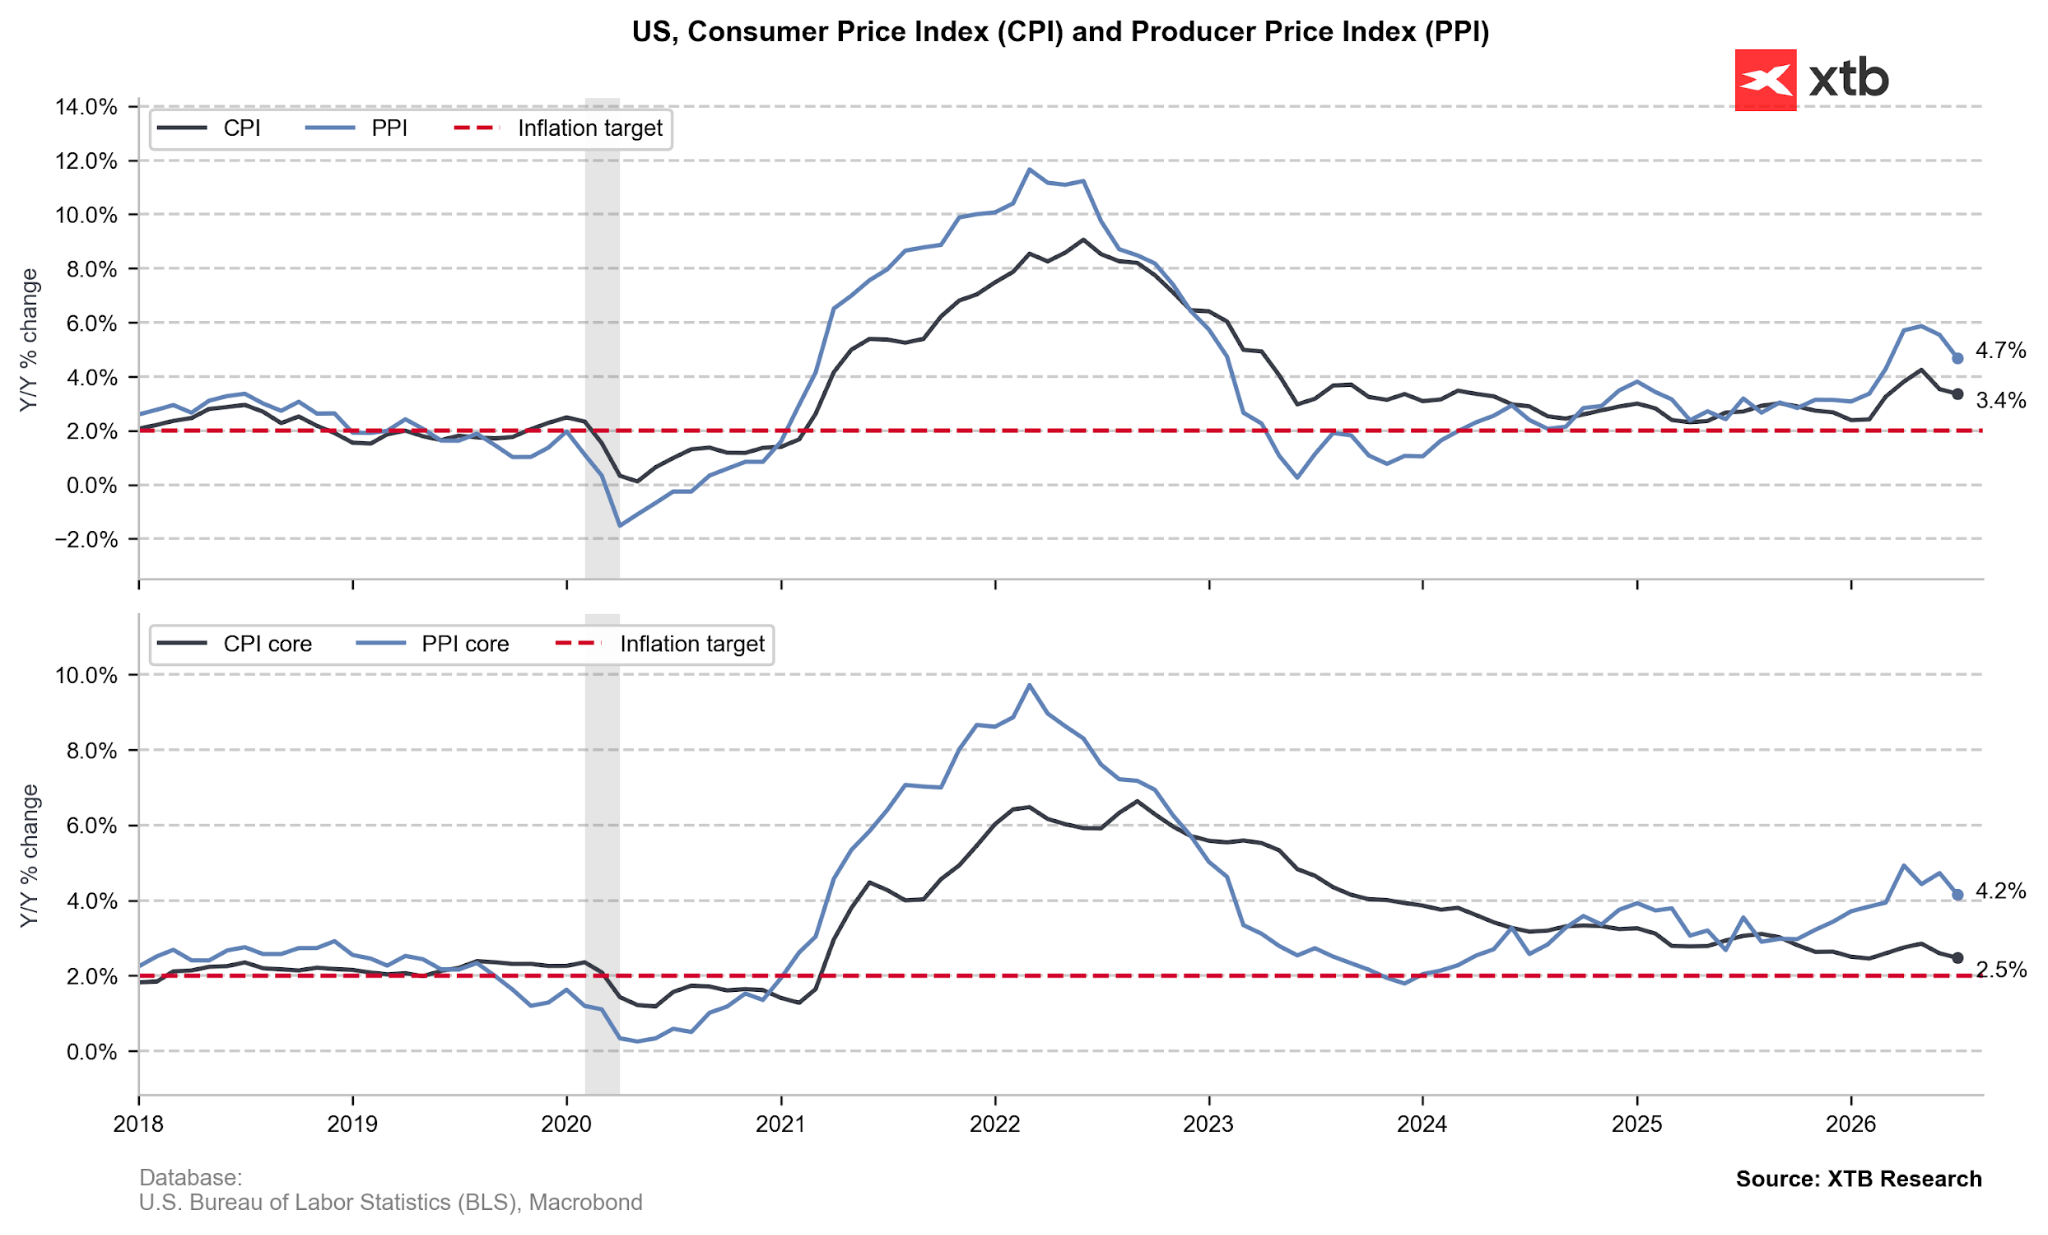
The July PPI inflation came in below expectations, although not across the whole spectrum.
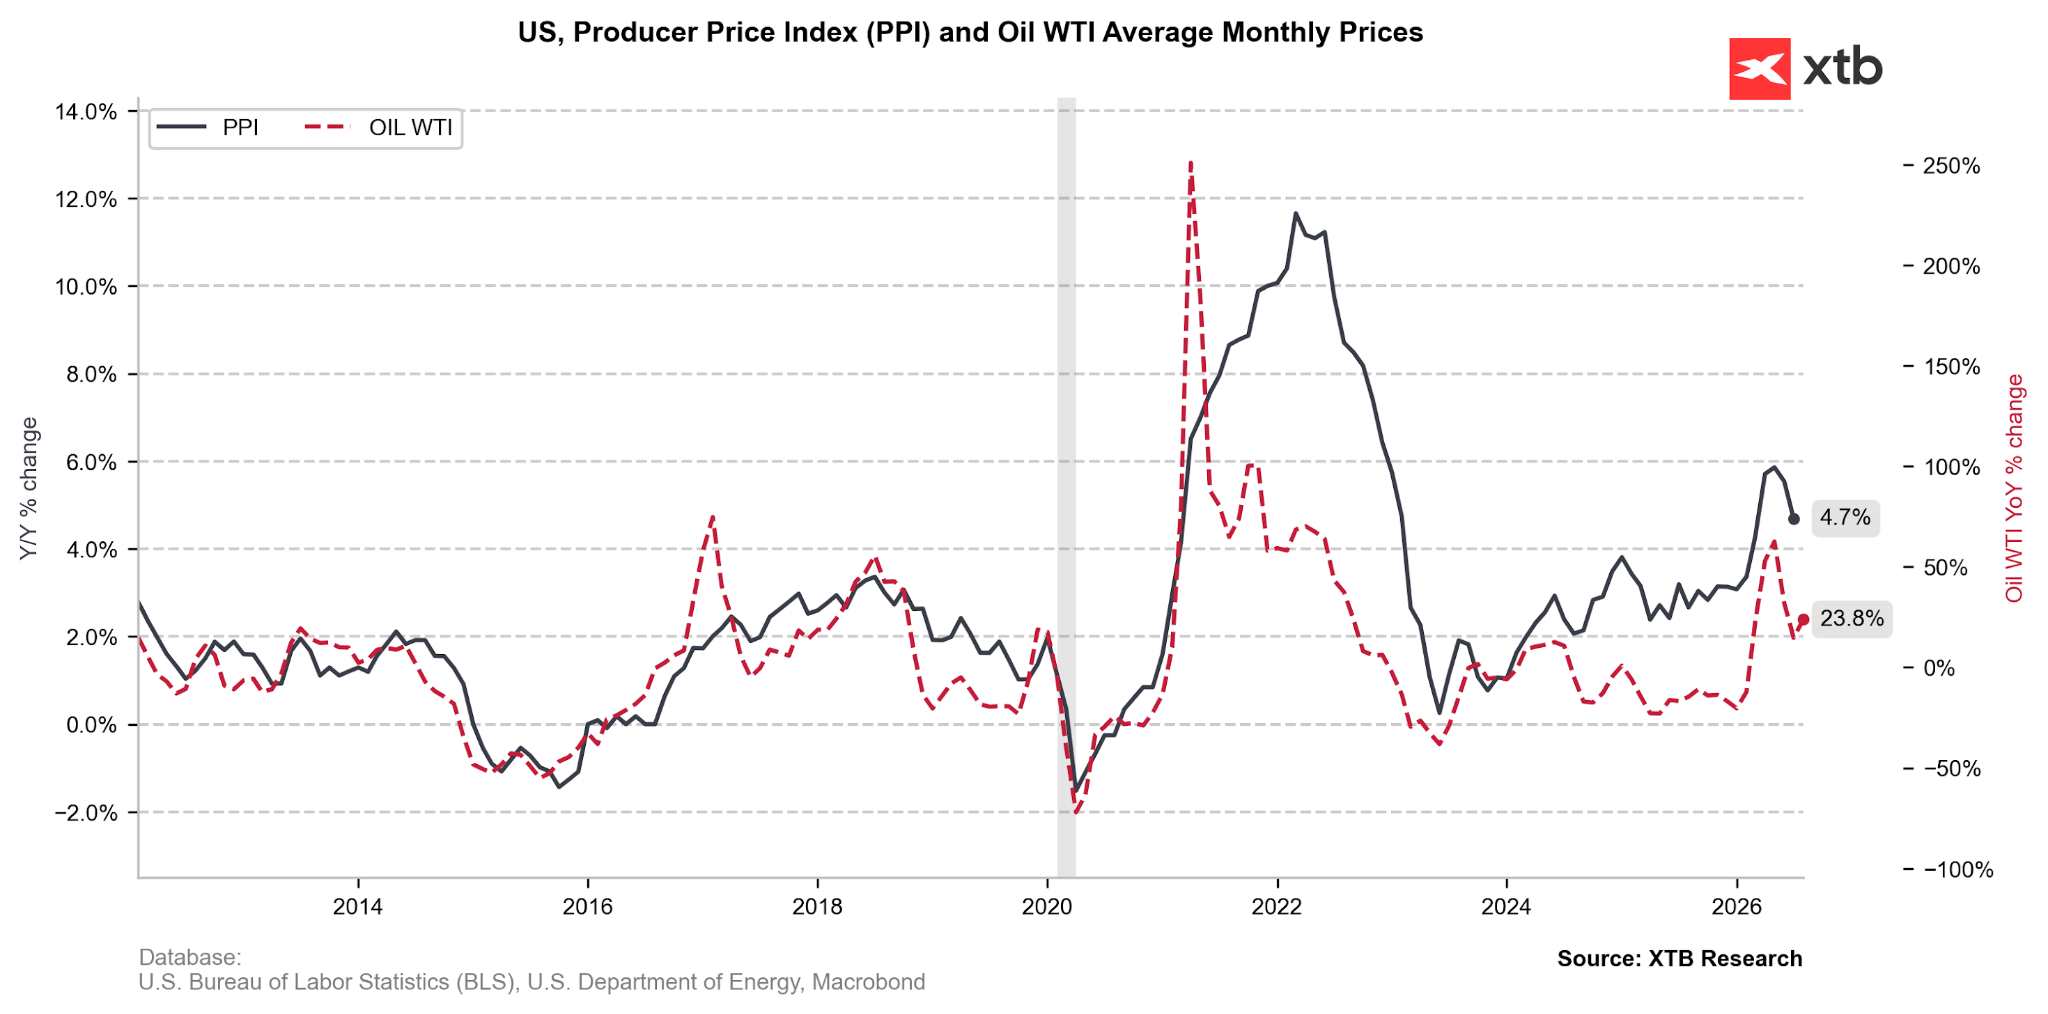
- The headline number dropped to 4.7% YoY, flat MoM.
- The core one came in at 4.7%, slightly above the consensus (4.6%). On the monthly basis (MoM) it increased by 0.4%.
Figure 1: US CPI & PPI Inflation (2018 – 2026)
Data breakdown:
- Goods (-0.7% MoM): Goods prices fell for the second consecutive month, driven down by a 3.1% decline in energy costs and a 0.9% drop in food prices.
- Over half of the decline in goods was caused by a 5.7% drop in gasoline prices. Diesel fuel, jet fuel, and fresh/dry vegetables also saw notable declines.
- Excluding volatile food and energy, goods prices actually rose slightly by 0.1%.
- Services (+0.2% MoM): Services continued to rise, primarily driven by a 0.6% increase in services excluding trade, transportation, and warehousing.
- A major driver was a 6.5% jump in portfolio management costs, along with higher retail margins for automobiles, food/alcohol, and health & beauty products.
- Construction (+2.2% MoM): Construction costs saw a sharp advance over the month, helping offset the drop in goods.
- Supercore (+0.4% MoM).
Figure 2: US PPI Inflation and WTI Oil (2012 – 2026)
Source: XTB Research, 13.08.2026
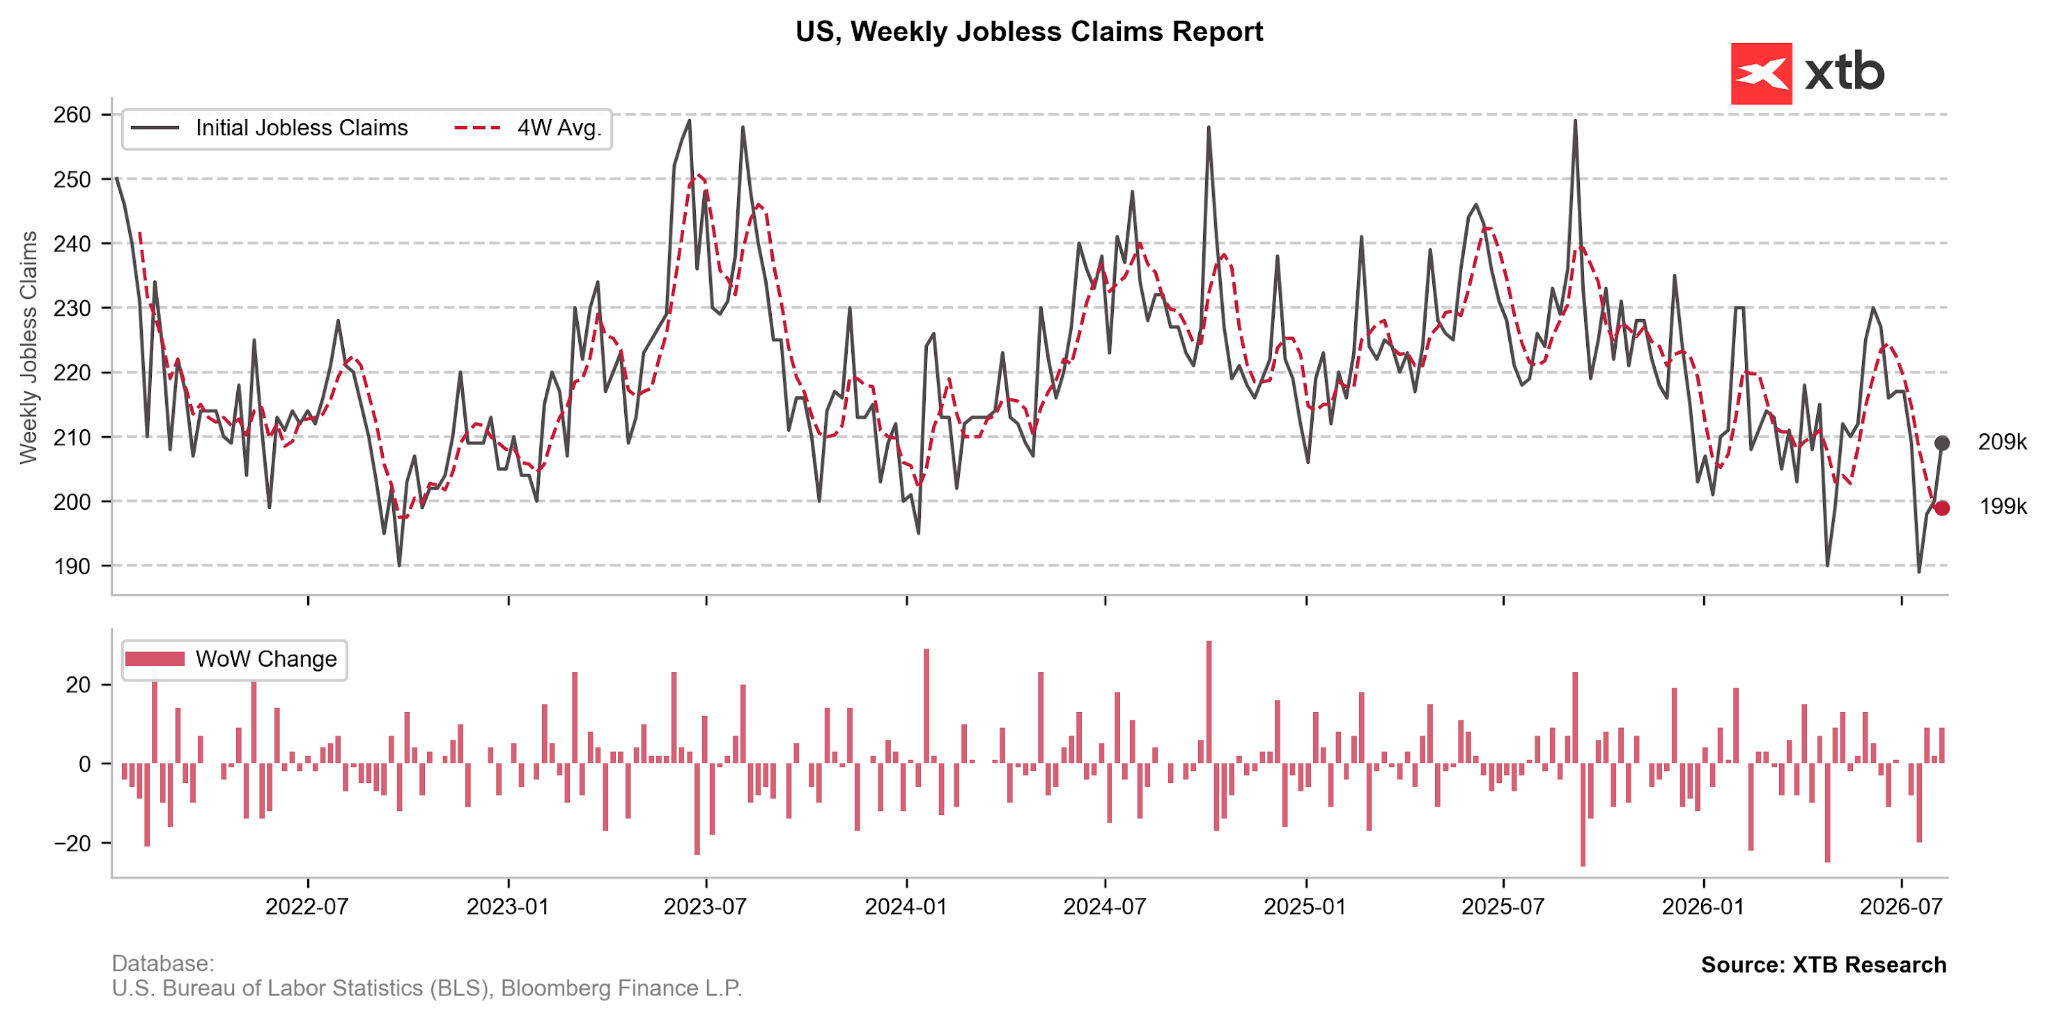
Meanwhile, Initial Jobless Claims ticked up to 209k, above the expectations (202k). This is broadly in line with the NFP data published last week, but still near local lows and consistent with a rather tight labor market.
Figure 2: Initial Jobless Claims (2022 – 2026)
The reaction of the EUR/USD is timid, with the pair up 0.2% on the day.
Nasdaq 100 futures are flat on the day, with S&P 500 up 0.2%.
—
Michał Jóźwiak, Financial Markets Analyst at XTB
XTB.COM


